


Summer of 2023 marked by Canadian wildfire smoke
The summer of 2023 will be remembered for long periods of rain, some of it very damaging, particularly for western New Hampshire and our neighbors in Vermont. In addition to the rain, the summer of 2023 gave us several stretches of quite uncomfortable heat and humidity. But perhaps most of all, summer 2023 will be remembered for the Canadian wildfire smoke that had such an impact on air quality in the Northeast and other areas of the United States. The wildfire smoke of 2023 kept air quality forecasting staff in the Air Resources Division very busy making air quality predictions and issuing Air Quality Action Days.
We initially had to issue two smoke advisories over the span of one week to account for the particle air pollution coming from our northern neighbor. The first advisory issued on May 31 was a warning for people who are sensitive to air pollution, or especially sensitive to smoke, but by the time the next week rolled around, we had elevated to a full Air Quality Action Day (AQAD), when the air pollution was expected to exceed the federal health standard. There have been seven total AQADs issued this year.
The wildfire smoke event began on June 6 and was the result of extensive wildfires in Quebec. The EPA AirNow map below shows levels of fine particulate matter (PM2.5), expressed in terms of the Air Quality Index (or AQI), measured over the northeastern United States on June 7.
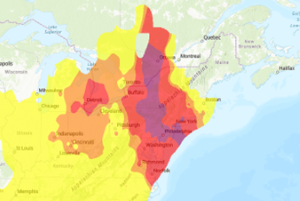
In this map, you can see widespread areas of Code Yellow (Moderate), Code Orange (Unhealthy for Sensitive Groups) and Code Red (Unhealthy). Even more alarming is the area of Code Purple (Very Unhealthy) that stretches from southern Quebec to the Mid-Atlantic. It is this level of air pollution that contributed to the apocalyptic-looking pictures and video that came out of New York City and other areas during this smoke event.
The table below shows just a handful of air quality monitoring stations in the Northeast and the maximum PM2.5 levels that were measured on June 7, expressed in units of AQI and micrograms per cubic meter (mg/m3).
| Location | Daily PM2.5 AQI | Daily PM2.5 Conc. (ug/m3) |
|---|---|---|
| Freemansburg, PA | 309 | 258.9 |
| Scranton, PA | 268 | 217.7 |
| Philadelphia, PA | 261 | 211.1 |
| Queens, NY | 254 | 203.5 |
| Syracuse, NY | 233 | 182.6 |
| Trenton, NJ | 222 | 172.0 |
| Wilmington, DE | 229 | 178.8 |
Source: EPA AirNow
On June 7, the monitoring station in Freemansburg, Pennsylvania measured a maximum PM2.5 concentration of almost 260 mg/m3, which corresponds to an AQI level of 309. This level is in the Code Maroon, or Hazardous, category. It is incredible to note that the measured PM2.5 levels in the table are not instantaneous maximums, but rather, concentrations averaged over a 24-hour exposure period (which is consistent with the health standards for PM2.5).
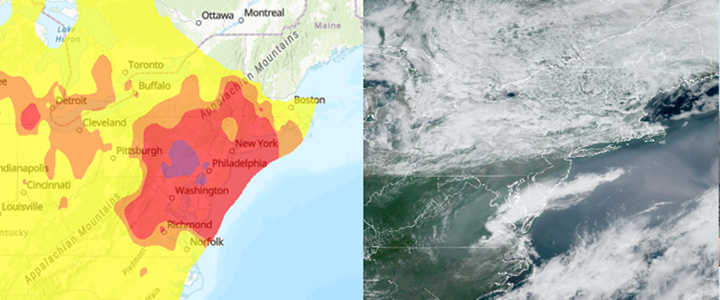
The map and image at the top of this article show measured PM2.5 levels on June 8 and a corresponding satellite image. On June 8, there were still widespread areas of Code Red and lingering areas of Code Purple. In the satellite image, the bright white areas are clouds. But with a trained eye, you can see the grayish wildfire smoke passing over Virginia, Maryland, Delaware and New Jersey and continuing to pour out over the Atlantic.
Quick New Hampshire Response
Why was New Hampshire spared from the brunt of this wildfire smoke even when other areas in the Northeast experienced such high levels of PM2.5? During the wildfire event that started on June 6, there was a low-pressure system that stalled over the Gulf of Maine. Meteorologists and weather enthusiasts will know that low pressure systems rotate in a counterclockwise direction. This rotation is why the smoke and particulate matter from the Quebec wildfires were directly transported into the Northeast and Mid-Atlantic. But because the center of the low-pressure system was so close to New Hampshire and Maine, these areas were out of reach of the rotating winds that brought such heavy smoke to other regions of the Northeast and Mid-Atlantic.
Even though this event mostly spared New Hampshire, its unprecedented nature motivated air quality forecasting staff and Air Resources Division leadership to ensure that NHDES and the State of New Hampshire are prepared to respond to extreme wildfire smoke events, should other ones ever occur that more directly impact New Hampshire. To do this, NHDES has been working with staff from the New Hampshire Health and Human Services Department and New Hampshire Homeland Security and Emergency Management to come up with enhanced health messaging, options for clean air and cooling centers, and other preparedness measures.
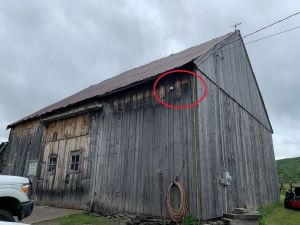 Another preparedness step that was taken because of the recent wildfire events was the decision to install a number of low-cost PM2.5 sensors, known as PurpleAir sensors, throughout the state. These low-cost sensors help NHDES air quality scientists gather additional data and learn even more about these events, which can help improve air quality forecasting. Two groups that don’t often get to work together, the Air Monitoring Program and the NHDES Dam Bureau, quickly came together to install a PurpleAir sensor at the Murphy Dam in Pittsburg,, as seen in the image below. These two groups acted quickly and efficiently so that we were able to start gathering additional PM2.5 data within one day.
Continuous monitoring, air quality forecasting and collaboration with other departments will allow NHDES to continue to protect the health of New Hampshire residents from extreme levels of wildfire smoke such as those that were observed in the northeastern U.S. during this event.