


Geologic Maps
Collecting and sharing authoritative, science-based information that supports good environmental decision-making.
Since the very first New Hampshire Geological Survey (NHGS) was inaugurated in 1839, geologists have been mapping the bedrock, surficial deposits, and mineral resources of the Granite State. Today’s NHGS carries on that tradition through its ongoing participation in the federal STATEMAP component of the National Cooperative Geologic Mapping Program. NHGS competes annually for matching funds from STATEMAP to support mapping projects with the greatest potential to yield societal benefits, as determined by the New Hampshire Geologic Resources Advisory Committee. We are committed to producing readily accessible map products in both traditional paper as well as digital formats to meet the our stakeholders’ needs for authoritative geologic information. Detailed mapping is generally performed at a scale of 1:24,000, covering individual 7.5-minute U.S. Geological Survey quadrangles. Geologic maps are an important information resource at the start of any site investigation or infrastructure project. They can serve as indispensable tools for addressing many existing environmental problems and for proper planning to avoid other environmental problems in the future. Municipalities interested in exploring the possibility of creating geologic maps to meet special needs, whether for planning or zoning or some other purpose, should contact NHGS.
Bedrock Geologic Mapping
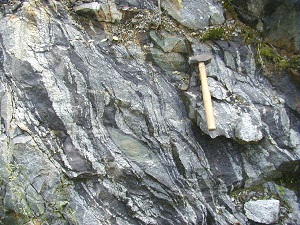
Bedrock maps classify and describe the different types of rock exposed at the surface or present just below the overlying surficial material. In New Hampshire, bedrock consists of relatively hard, dense igneous and metamorphic (crystalline) rocks comprised of tightly interlocking mineral grains. Although one’s first impression of the bedrock is that it is essentially one solid mass, closer inspection (say where a thick section of rock is exposed in a road-cut) usually reveals that the rock is broken up to varying degrees by cracks that run in different directions and sometimes intersect at different angles. The extent to which the bedrock has been folded or sheared or fractured along zones of weakness is of special interest to hydrogeologists and geotechnical engineers. On the one hand these properties of the rock define its ability to yield groundwater to wells drilled into it, and on the other hand they determine its stability as a foundation for large buildings or its resistance to blasting. View the status map to learn what mapping has been completed and what is currently in progress. If you are looking for a specific map you can search the publications library using keywords for town or quadrangle names. You can also create a custom search window to query the National Geologic Map Database by your location of interest.
Surficial Geologic Mapping
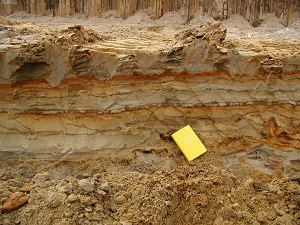 Surficial geologic maps characterize the different earth materials of varying thicknesses that lie above the bedrock. The New Hampshire landscape is mostly the legacy of erosion and deposition by the last continental glacier and subsequent "re-working" by the agents of wind, running water, gravity, and humans over the last 12,000 – 14,000 years. Scouring and sculpting of the bedrock by the massive ice sheet produced an enormous amount of eroded materials, ranging from boulders to particles of clay. Some materials were re-deposited under the advancing ice and others were transported and laid down by meltwaters as the ice thinned and finally melted completely. These earth materials make up the surficial deposits that we map today and allow us to reconstruct their glacial history. Because much of the water supply for the state’s communities is stored in or extracted from surficial deposits, these maps provide a critical source of information for developing new groundwater water sources and protecting existing sources from contamination. View the status map to learn what mapping has been completed and what is currently in progress. If you are looking for a specific map, you can search the publications library using keywords for town or quadrangle names. You can also create a custom search window to query the National Geologic Map Database by your location of interest.
National Hydrography Dataset (NHD)
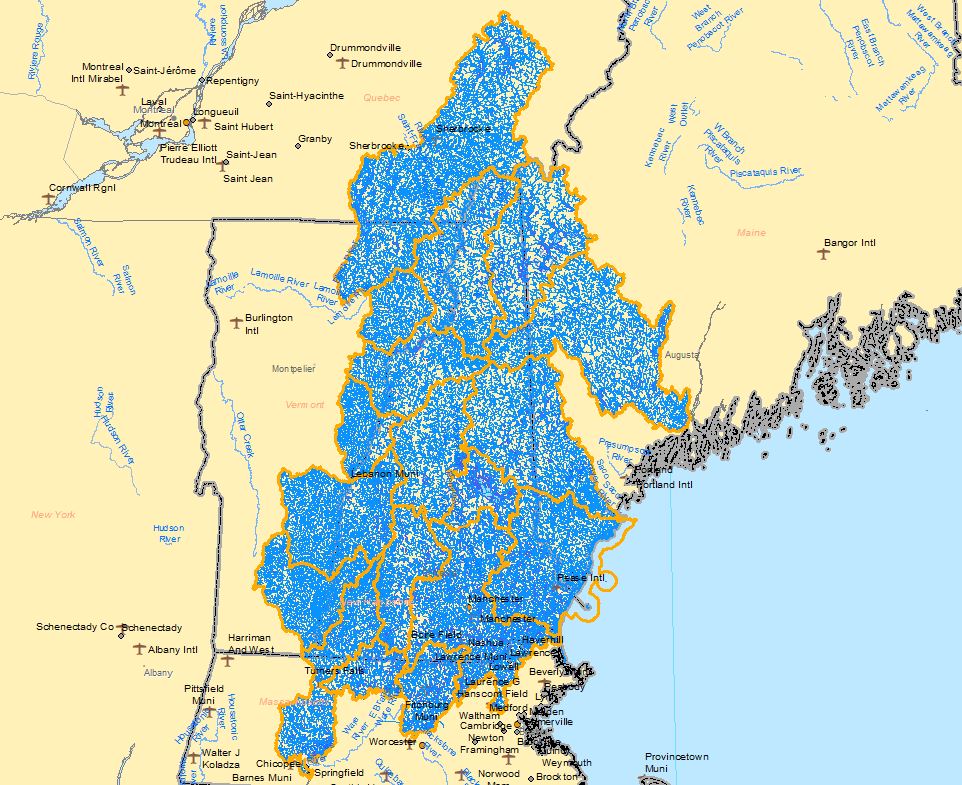
The National Hydrography Dataset and its companion product, the Watershed Boundary Dataset (WBD), are digital spatial data that simulate the real network of streams, rivers, lakes, ponds and wetlands and their topographic drainage divides that are such familiar features of the New Hampshire landscape. This nationwide dataset is housed and distributed by the U.S. Geological Survey and is a framework layer within the larger body of GIS data that forms the National Spatial Data Infrastructure.
Related Content
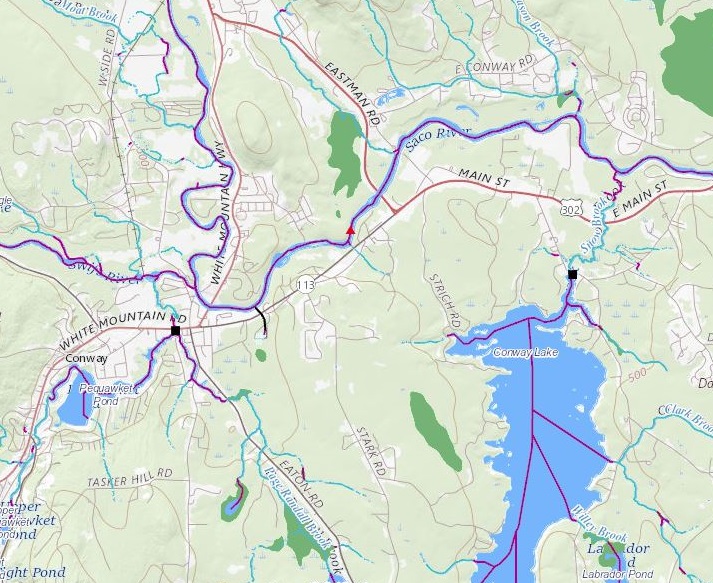
NHGS is the federally designated steward of NHD and WBD in New Hampshire and is responsible for updating and enhancing the network with input provided by other NHDES staff and the general public. To view the NHD in an interactive and searchable web map, check out the NHD Viewer. There you can virtually navigate the surface water network and find other datasets linked to the NHD like dams, bridges, culverts and gaging stations, and also view the WBD. NHD provides a unique address for each location along the network, much like a street address assigned to a road network.
For more information about the NHD and how to access the data, click on the link below. Go to the National Map download page and tailor fit your data download by state, watershed boundary, or keyword queries. If you prefer to download NHD data for the entire state, go to the USGS Staged Products Directory and look for New Hampshire.
Do you have an unmapped stream or waterbody in your backyard or on your favorite trail? Have you noticed any incorrectly mapped streams or rivers? Did you notice an incorrect watershed boundary on your last ridge-crest hike? We would like to hear from you! Use the NHD Viewer to find your area of interest and check if the water feature or watershed boundary appears on the map and in the correct location. To submit corrections, use the Markup App. You will need the Google Chrome web browser with a Gmail account. If you would prefer to submit NHD corrections directly to NHGS, send an email to the NHD data steward.
LiDAR
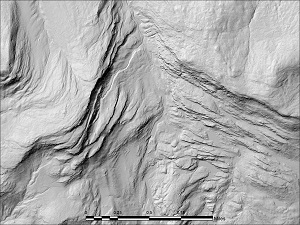 Almost anyone who has ever gone hiking or fishing in New Hampshire at one time or another has used a USGS topographical quadrangle map: blue for water and brown elevation contour lines marking the land surface highs and lows, uphills and downhills, steeply or gently sloping. For decades these maps served as the best available source for elevation data -- until the widespread use of airborne light detection and ranging (LiDAR) technology to acquire a whole new high-resolution dataset of land surface elevations. This remote sensing technology uses a rapidly pulsing laser to scan the land surface from high above, effectively seeing the ground beneath the trees. New Hampshire now has LiDAR data statewide and NHGS has worked long and hard to help achieve this goal. Geology is everywhere and elevation matters. From our Seacoast beaches to the peaks of the Presidential Range in the White Mountains, New Hampshire’s diverse topography creates the dramatic landscapes and scenery admired by residents and visitors alike. The availability of LiDAR data has been a major benefit to our geologic mapping program, allowing us to identify landforms that might otherwise be obscured by tree cover and nearly impossible to observe in the field. In fact, all of our mapping activities benefit from LiDAR. We all know that water flows downhill and even the smallest stream channel can be detected with LiDAR, enabling NHGS to be better stewards of NHD. Even man’s handiwork in the form of the network of historic stone walls that crisscross the New Hampshire landscape are revealed by LiDAR. The NH Stone Wall Mapper provides an opportunity for anyone to easily explore the LiDAR landscape while helping to map stone walls. For more information and metadata, check out GRANIT.
Other data available from NHGS:
- Fluvial Geomorphology Data: In response to several damaging floods in the early 2000s, NHGS embarked upon an effort to collect and map data regarding the fluvial geomorphology of New Hampshire’s rivers and streams. Data was collected by on-the-ground field mapping in the rivers and streams themselves. The collected data includes information on the locations of riverbank erosion, bank armoring, woody material jams, and locations of potential channel migration, among others. A total of 400 miles of rivers and streams, primarily in southern New Hampshire were assessed and mapped while this effort was active. Available data are valuable if you are planning to start a river alteration or restoration project. Anyone who would like to access this data for project purposes should contact NHGS. More information available on the Flooding in New Hampshire page.
- Soil Geochemistry: In 2008, NHGS participated in The North American Soil Geochemical Landscapes Project. O-, A-, and C-horizon soil samples were collected from 63 sites across the state and were analyzed for a suite of 34 different elements. Anyone who would like to learn more about the specific sample locations and the geochemical results should contact NHGS.
- Rock Geochemistry and Mineralogy: Major and trace element concentrations were analyzed by X-ray fluorescence for 103 unweathered rock samples collected by NHGS as part of a multi-year investigation of potential geothermal resources in the state. Modal analyses of mineral composition in thin sections of these samples were also completed. Uranium, thorium, and potassium data were compiled from published and unpublished sources for an additional 236 analyses. All data can be accessed at through the web services NHDES GIS data project portal. Contact NHGS for additional information about the project.
- Geothermal: Bottom borehole temperatures and downhole temperature profiles were measured for 20 bedrock wells by NHGS and the U.S. Geological Survey as part of a multi-year investigation of potential geothermal resources in the state. Thermal conductivity was measured for 105 unweathered rock samples. All data can be accessed through the web service links above. Contact NHGS for additional information about the project.
- Depth to Bedrock: Maps of depth to bedrock (overburden thickness) were generated by NHGS for the Piscataqua/Coastal, Merrimack, and Winnipesaukee HUC8 watersheds. Data input for the statistical mapping procedure included depth to bedrock values reported as part of the New Hampshire Water Well Inventory and bedrock outcrop locations from 1:24,000-scale geologic maps produced by NHGS under the cooperative STATEMAP program. NHGS is currently compiling additional data to create a new depth to bedrock map for the area of the Lowell 100,000-scale quadrangle located along the New Hampshire/Massachusetts border. Contact NHGS for additional information about this project and the existing depth to bedrock maps.